A Map and Data tale during COVID-19 times
With the beginning of COVID-19 pandemic and its impact on people's lives, Mapidea took upon a mission to show how COVID-19 is affecting the Portuguese population. We felt the need to contribute to the community and translate the data published by the official sources into meaningful information, to better understand the situation we are living in.

Figure 1 - COVID-19 cases per 10.000 inhabitants in Portugal
Since March 23, the Portuguese Directorate-General for Health publishes daily status reports with the number of COVID-19 cases by municipality. This is vital data to understand the evolution of the situation in regions, and to be able to study the impact on territorial dynamics. Since then, Mapidea team publishes a daily map with these results on social media. Instead of showing the absolute value, we chose to relate the number of cases to the population (summarizing the metric per 10,000 inhabitants). In this way, we could make a more direct comparison between municipalities, given that Portugal has large differences in terms of the amount of population per municipality. Getting the absolute value can only lead to a misinterpretation of the situation.
With this, we could see the evolution of the number of cases every day. Since it is a daily phenomenon, we had to choose a flexible legend that could be maintained throughout several days and allowed to compare different days. However, after 18 days the number of cases in some municipalities in the North of Portugal, namely Ovar, Porto and Matosinhos, was so high that it was not possible to make a visual distinction between the municipalities; because of that, we had to change the map classes twice.
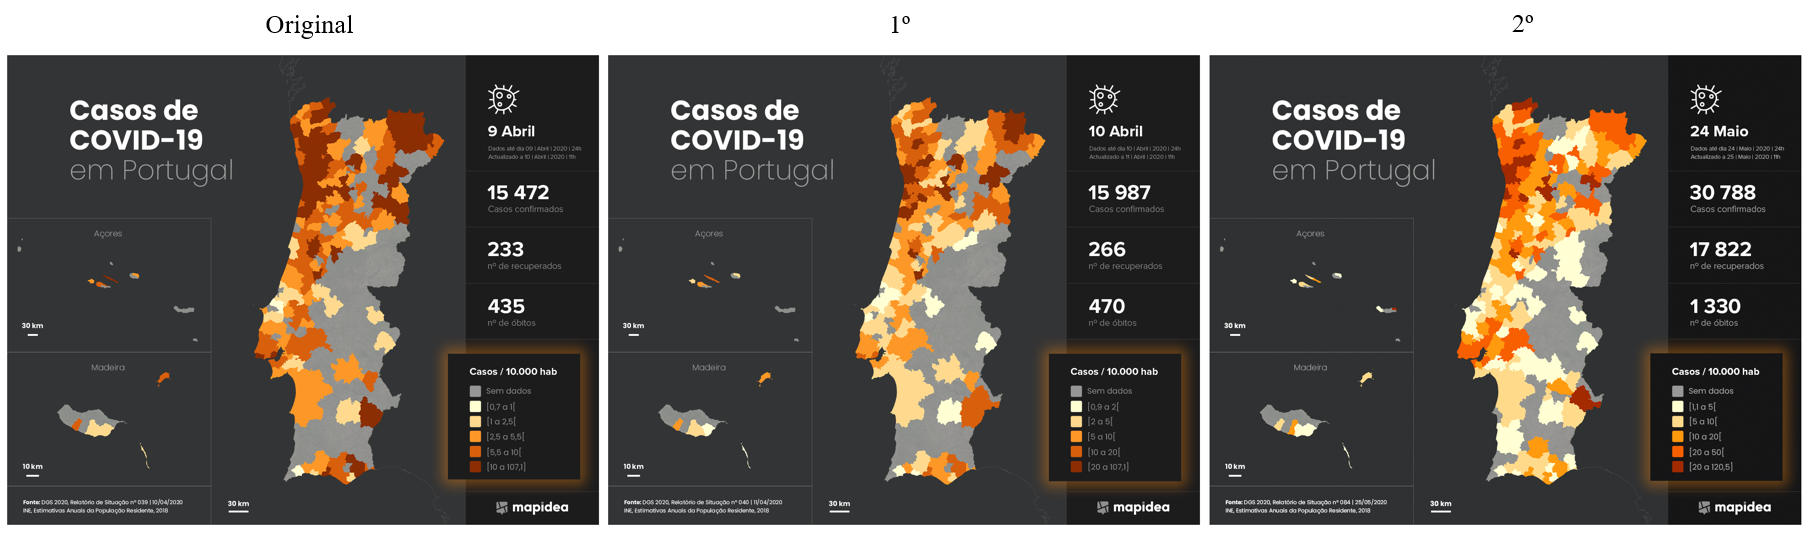
Figure 2 - Map classes change in Portugal
We also created a dashboard that presents data on the evolution of COVID-19 along with population data, with a special emphasis on people for whom the virus is of a greater risk (people aged 65 and over) (Figure 3).

Figure 3 - Covid-19 Portugal dashboard
As the COVID-19 confirmed cases are evolving in the country, there are regions that stand out due to a high number of cases. For instance, Lisbon Metropolitan Area (AML) and Porto Metropolitan Area (AMP) concentrate more than half of the COVID-19 cases in Portugal.

Figure 4 - Covid-19 evolution in Lisbon Metropolitan Area (AML) and Porto Metropolitan Area (AMP) until June 30