Health, Data Privacy and Geography
It’s safe to say that when someone thinks about Medicine, it doesn’t think about maps. Except if we were talking about COVID-19, in the last three years. We have witnessed the power of maps applied to the Healthcare sector: Every country, one time or another, showed the evolution of COVID-19 cases in a map. Those maps had the merit of making people understand the evolution of the pandemic and portraited a very accurate “movie” of what was really going on. They also served as an incentive for people to do what was necessary to protect themselves and others.
It was one of the first times where I saw health data being publicly available, quickly updated and transparent.
Raw health data must be prepared before producing results, as it needs maintain the anonymity of patients. It takes time and precision from the data team to make sure nothing that can identify a patient goes to the end product.
Since 2018, in the EU, people, companies, and organizations must follow the “General Data Protection Regulation”, in which personal data, data processing methods, data subject, data controller and data processor must follow certain rules to protect the individuals that use their services. The data protection principles are seven (GDPR):
Lawfulness, fairness and transparency — Processing must be lawful, fair, and transparent to the data subject.
Purpose limitation — Data must be processed for the legitimate purposes specified explicitly to the data subject when you collected it.
Data minimization — Collect and process only as much data as necessary for the purposes specified.
Accuracy — Personal data must be accurate and up to date.
Storage limitation — Personal identifying data must only be stored for as long as necessary for the specified purpose.
Integrity and confidentiality — Processing must be done in such a way to ensure appropriate security, integrity, and confidentiality (e.g. by using encryption).
Accountability — The data controller is responsible for being able to demonstrate GDPR compliance with all these principles.
Public health entities had to make sure that those principles were respected when disclosing the COVID-19 data for small regions. As an example, in Portugal and in the UK, regions with less than 3 cases weren’t showed, complying with the 6th principle. When disclosing sensitive data is important to make sure that the lower spatial unit used is enough to maintain confidentiality. The spatial dimention adds a significative concern regarding this type of data: if you’re thinking of disseminate data at a lower level of aggregation, i.e. small geographies with small number of residents, confidentiality is not automatically ensured. Nothing better than a map to portrait an example:

4 regions with different population and cases
In Image 1, in a given area we have the number of residents and the number of infected residents in each one. In areas B and C, we don’t find any anonymity problems, as we can’t find out who all those persons are. In area A, 3 residents are infected, but we don’t have the information about the relation between these 3 people, they could be from the same household or 3 persons of 3 different households, so the infection can be contained in a household or can possible be a source of contamination all over the given area. In area D, as it has fewer people the anonymity of the person infected is not secured.
Statistical organizations have options like aggregating data in a higher level geography or in a larger population subgroup, suppressing or replacing unsafe cells with a special character, rounding information or removing risky records from the dataset (GSS, 2014). That way the original counts in the data are not damaged, however detail in the table will be reduced.
Why is relevant to share this type of data? If Health organizations share information for public domain, it can be used to produce even more insights from the data. By combining different datasets, it’s possible to create content and broadcast useful information to generate more awareness.
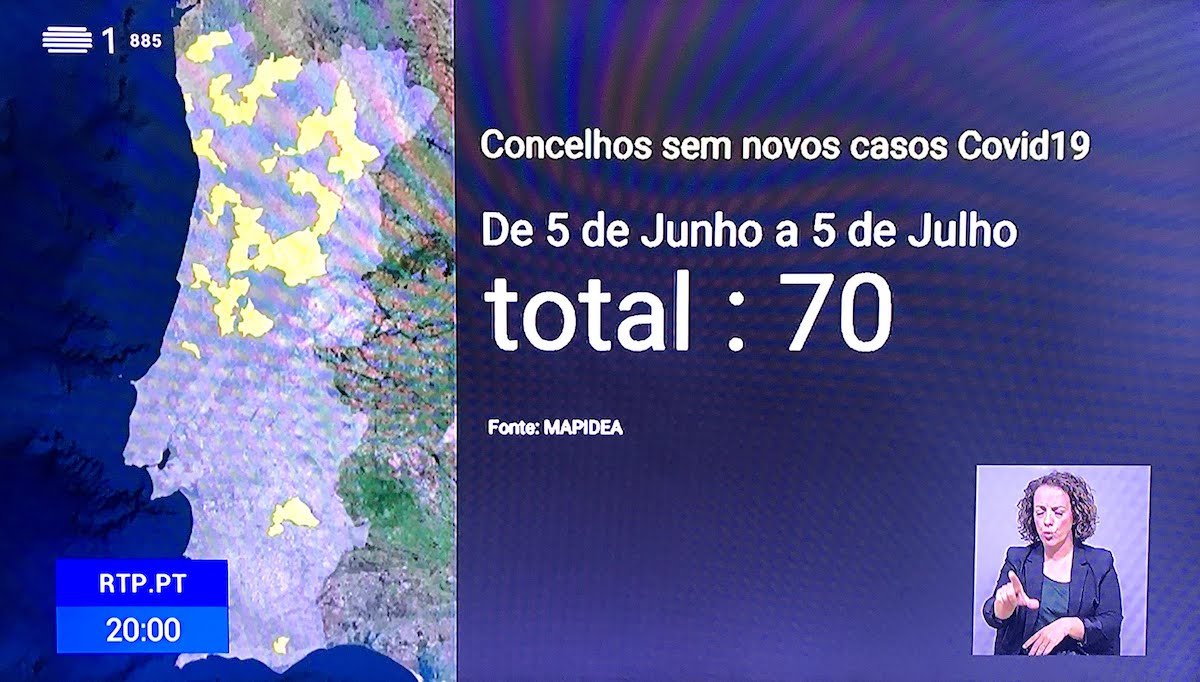
Map with the location of the municipalities without new COVID cases in Portugal, in June - RTP, Telejornal
With COVID-19 data we saw a lot of dashboards coming up to show the evolution of cases. Mapidea – who has the social mission of increase statistical literacy using maps - was one of the companies that made those to help broadcast information about COVID-19. We have created a dashboard for Portugal and the UK, showing the evolution of the number of cases through the last 2 years, and a map with the number of cases per 10.000 residents (COVID-19 PT and COVID-19 UK). Unfortunately, the Portuguese and the UK National health entities stopped releasing data with the recurrence they had when they started and it stopped being updated.
Health and Geography have historical relevant relations: In 1854 we have witnessed how looking at data with a spatial perspective makes all the difference (John Snow really knew the power of maps…). Imagine if health data, respecting the GPDR normative, were release to the public to be worked on, the spatial patterns we could find out only by mapping it, and how it could help to contain future diseases. Let’s stay healthy and map the way!